Fiscal year 2025 key statistics
| Operational highlights |
12 months ended September 30 (except where noted) |
|
2023 |
2024 |
2025 |
| Total volume2 |
$14.8T |
$15.7T |
$16.7T |
| Payments volume2 |
$12.3T |
$13.2T |
$14.2T |
| Transactions processed on Visa’s networks3 |
212.6B |
233.8B |
257.5B |
| Payment credentials4 |
4.3B |
4.6B |
4.9B |
| Financial highlights (GAAP) |
In millions (except per share data) |
|
FY 2023 |
FY 2024 |
FY 2025 |
| Net revenue |
$32,653 |
$35,926 |
$40,000 |
| Operating expenses |
$11,653 |
$12,331 |
$16,006 |
| Net income |
$17,273 |
$19,743 |
$20,058 |
| Diluted class A common stock earnings per share |
$8.28 |
$9.73 |
$10.20 |
| Financial highlights (non-GAAP)1 |
In millions (except per share data) |
|
FY 2023 |
FY 2024 |
FY 2025 |
| Operating expenses |
$10,481 |
$11,609 |
$12,906 |
| Net income |
$18,280 |
$20,389 |
$22,542 |
| Diluted class A common stock earnings per share |
$8.77 |
$10.05 |
$11.47 |
Stock performance
The accompanying graph and chart compare the five-year cumulative total return on Visa’s class A common stock with the cumulative total return on Standard & Poor’s 500 Index and Standard & Poor’s 500 Financials Index from September 30, 2020 through September 30, 2025. The comparison assumes an initial investment of $100 in Visa’s class A common stock and in each index on September 30, 2020, and that all dividends were reinvested. There is currently no established public trading market for Visa’s class B-1, B-2 or C common stock.
The accompanying chart compares the 10-year cumulative total return on Visa’s class A common stock with the cumulative total return on Standard & Poor’s 500 Index and Standard & Poor’s 500 Financials Index from September 30, 2015 through September 30, 2025. The comparison assumes that all dividends were reinvested.
| Company / index |
10-year cumulative return |
| Visa |
426% |
| S&P 500 Index |
315% |
| S&P 500 Financials Index |
258% |
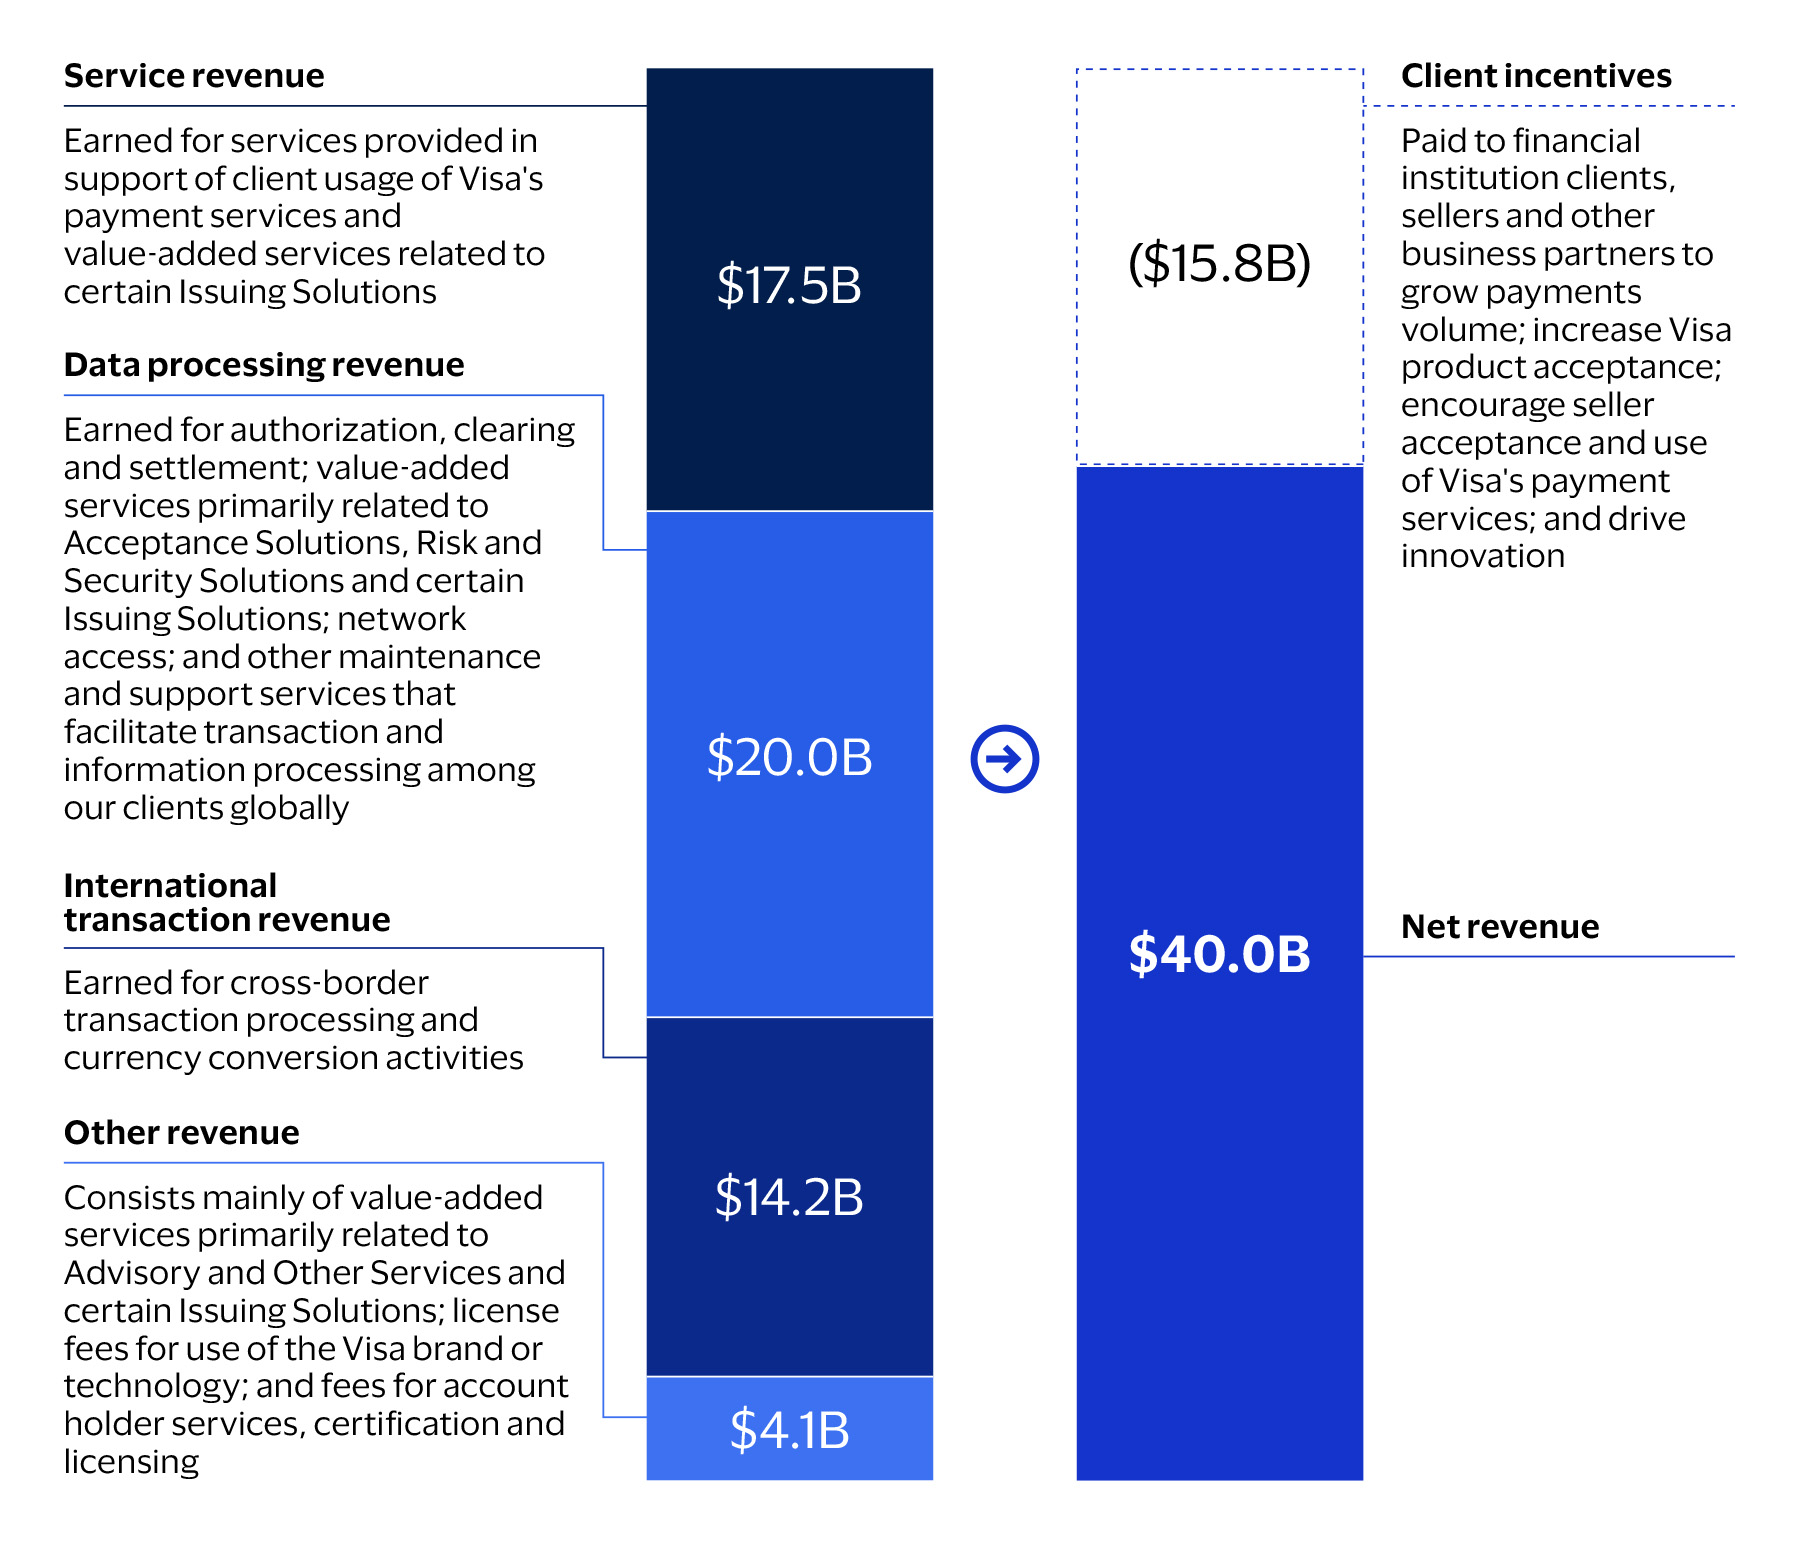
Net revenue details